EGNT – Newcastle International Airport
Tier A (measured) · 420 movements in 2026 · milestones measured from APDF
Excellent coverage. Nearly every movement in 2026 is picked up, and 92% of the position reports expected while taxiing out actually arrive. Aircraft are tracked essentially throughout their time on the ground, so surface events can be derived with confidence.
| period | departures | arrivals | Departures seen (%) | Arrivals seen (%) | Coverage index |
|---|---|---|---|---|---|
| 2026 | 216 | 204 | 99.5% | 100.0% | 0.956 |
| 2025 | 211 | 197 | 94.3% | 93.4% | 0.873 |
| 2024 | 189 | 181 | 94.2% | 93.9% | 0.865 |
Departures
off_s is good when negative – the track began before take-off.
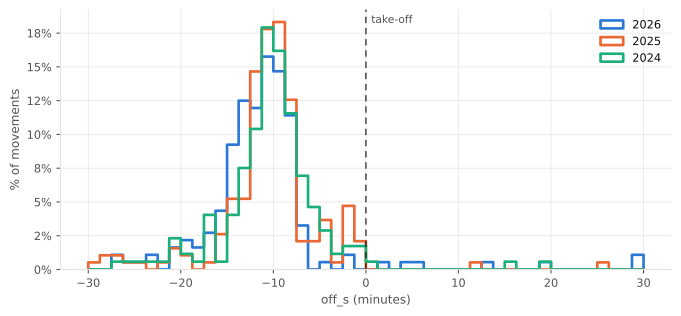
When the track starts, relative to take-off (minutes)
| period | n | p10 | p50 | p90 |
|---|---|---|---|---|
| 2026 | 215 | -17.1 | -10.8 | +33.2 |
| 2025 | 199 | -17.2 | -10.3 | -4.5 |
| 2024 | 178 | -16.6 | -10.1 | -4.6 |
| delta 2026-2025 | +0.1 | -0.5 | +37.7 |
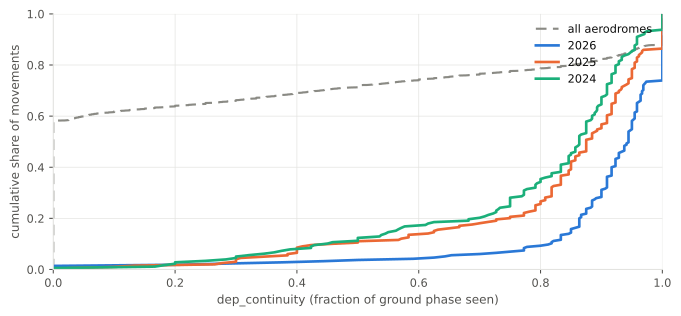
How much of the taxi-out was received (1.00 = every expected report arrived)
| period | n | p10 | p50 | p90 |
|---|---|---|---|---|
| 2026 | 215 | 0.802 | 0.917 | 1.000 |
| 2025 | 199 | 0.465 | 0.861 | 0.983 |
| 2024 | 178 | 0.451 | 0.840 | 0.933 |
| delta 2026-2025 | 0.337 | 0.056 | 0.017 |
Arrivals
land_s is good when positive – the track ran on past landing.
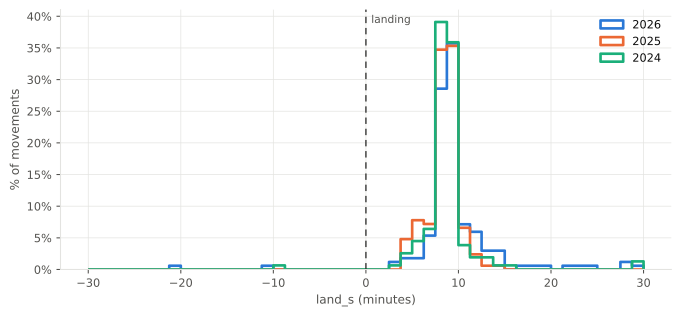
When the track ends, relative to landing (minutes)
| period | n | p10 | p50 | p90 |
|---|---|---|---|---|
| 2026 | 204 | +3.2 | +9.0 | +27.9 |
| 2025 | 184 | +6.0 | +8.7 | +11.6 |
| 2024 | 170 | +6.9 | +8.7 | +13.0 |
| delta 2026-2025 | -2.8 | +0.3 | +16.3 |
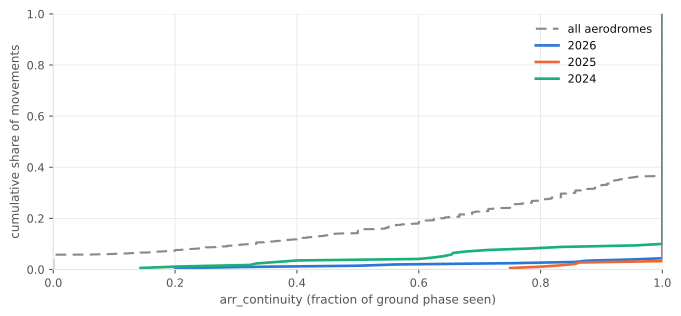
How much of the taxi-in was received (1.00 = every expected report arrived)
| period | n | p10 | p50 | p90 |
|---|---|---|---|---|
| 2026 | 204 | 0.989 | 1.000 | 1.000 |
| 2025 | 183 | 1.000 | 1.000 | 1.000 |
| 2024 | 170 | 0.952 | 1.000 | 1.000 |
| delta 2026-2025 | -0.011 | 0.000 | 0.000 |
Where the coverage is
Each position report is placed on a hexagonal grid over the aerodrome, on a log colour scale: one apron cell can hold thousands of reports while a runway threshold holds tens. Empty ground is surface the receivers do not reach.
Use the legend to add the airborne layer and any example flights. Scroll to zoom.
Against the fleet
How this aerodrome compares with the 89 aerodromes with measured milestones. Typical aerodrome is the median across all of them. Rank is this aerodrome’s position among them, 0 (lowest) to 100 (highest).
| measure | this aerodrome | typical aerodrome | rank (0–100) |
|---|---|---|---|
| Coverage index | 0.956 | 0.590 | 80 |
| Departures seen (%) | 99.5% | 99.7% | 37 |
| Taxi-out received (median) | 0.917 | 0.191 | 78 |
| Taxi-in received (median) | 1.000 | 1.000 | 43 |
| Track start vs take-off (min, median) | -10.8 | -1.8 | 12 |
| Track end vs landing (min, median) | +9.0 | +7.2 | 64 |
Higher rank is better everywhere except track start vs take-off, where a low value is the good case.
Was each flight tracked as one flight?
A poor coverage number can mean the receivers heard nothing, or that the algorithm cut the flight’s track up. This separates them.
| period | One flight, one track (%) | Split across tracks (%) | Merged with another flight (%) |
|---|---|---|---|
| 2026 departures | 80.1% | 19.0% | 0.5% |
| 2026 arrivals | 82.4% | 17.6% | 0.0% |
| 2025 departures | 87.2% | 6.6% | 0.5% |
| 2025 arrivals | 88.3% | 4.6% | 0.5% |
| 2024 departures | 89.4% | 4.8% | 0.0% |
| 2024 arrivals | 86.7% | 7.2% | 0.0% |
The underlying counts
Everything above is derived from these. Typical taxi times are context: the same 200 seconds of reception is most of a short taxi and a fraction of a long one.
| period | Departures | Departures seen | Arrivals | Arrivals seen | Unusable reference rows | Typical taxi-out (min) | Typical taxi-in (min) |
|---|---|---|---|---|---|---|---|
| 2026 | 216 | 215 | 204 | 204 | 0 | 12.0 | 4.0 |
| 2025 | 211 | 199 | 197 | 184 | 0 | 12.0 | 3.0 |
| 2024 | 189 | 178 | 181 | 170 | 0 | 12.0 | 4.0 |