Airport coverage rankings
How much of a flight OpenSky’s receivers actually see, per aerodrome.
When an aircraft moves at a European airport, how much of that movement do OpenSky’s receivers actually see?
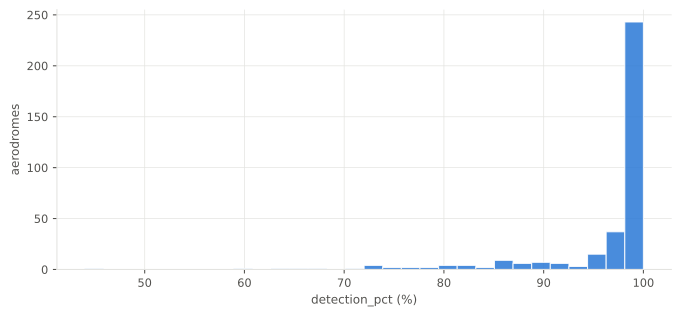
The flight is nearly always spotted somewhere: detection is above 99% almost everywhere. But that’s not the same as being followed across the apron and down the runway: what these rankings measure.
Both tables cover three sampled days, 5–7 June 2026. Each aerodrome’s page adds 2025 and 2024, the same three days of the same month.
Hover a column heading for what it measures. Metrics has full definitions; click an aerodrome for its map and history.
NoteTier A (measured by APDF) and Tier B (estimated by NM)
The tier decides what can be measured.
Tier A (measured by APDF). The airport’s own records give the real times: off-block, take-off, landing, in-block. The taxi has exact bounds, so how much of it arrived is a measurement.
Tier B (estimated by NM). Network Manager gives an off-block time and a predicted taxi duration – an estimate, not a measured one. With no runway times, take-off is inferred, so only a median across a few hundred movements is worth reading.
There is no in-block time either, so nothing ends a taxi-in; NM’s arrival time is off-block plus predicted taxi plus predicted flight duration, adding nothing. Tier B therefore gets no arrival coverage, and the coverage index needs both sides.
The all-aerodromes table holds both, its taxi-out column filled throughout and asterisked where the window was measured.
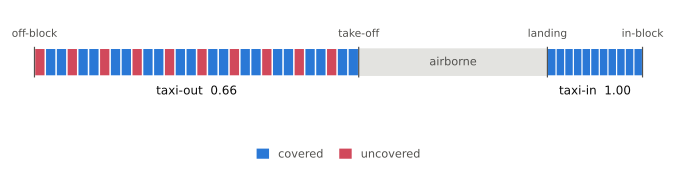
One flight, scored
| from | to | duration | expected total # reports (every 5s) | received | share | |
|---|---|---|---|---|---|---|
| taxi-out | 12:13:41 | 12:33:00 | 19.3 min (1,159 s) | 232 | 154 | 0.664 |
| taxi-in | 14:34:00 | 14:39:40 | 5.7 min (340 s) | 68 | 68 | 1.000 |
That is EDDF to EFHK, 6 June 2026. An aerodrome’s figure is the median of these across its flights, each side separately, so one badly received flight cannot move it. The coverage index multiplies the share seen at all by the average of the two medians.
Tier A (measured by APDF)
89 aerodromes with all four milestones on record: off-block, take-off, landing, in-block.
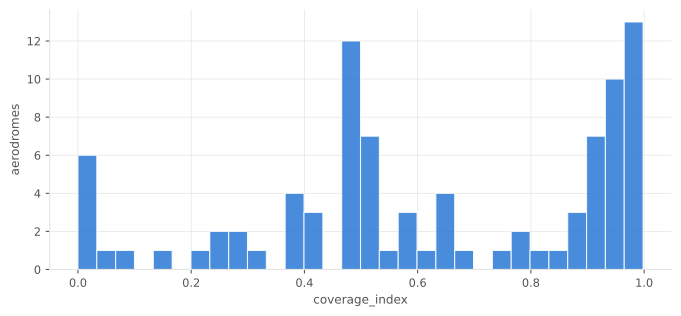
Ranked on the coverage index: share seen at all, times how much of a typical ground movement arrives.
Every row and column, for 2026. Blanks are blank, not dashed, so a spreadsheet reads the column as numbers.
Loading ITables v2.9.1 from the init_notebook_mode cell...
(need help?)
|
| ⓘ# | ICAO | Aerodrome | Movements 2026 sample (3 days) | Coverage index | Coverage | Flights seen (%) | Tracking errors (%) |
|---|---|---|---|---|---|---|---|
| 1 | EBBR | Brussels Airport | 1645 | 0.998 | Excellent | 99.8 | 11.4 |
| 2 | LSZH | Zürich Airport | 2365 | 0.996 | Excellent | 99.8 | 14.8 |
| 3 | EICK | Cork International Airport | 242 | 0.996 | Excellent | 99.6 | 12.3 |
| 4 | EFHK | Helsinki Vantaa Airport | 1253 | 0.989 | Excellent | 99.1 | 21.9 |
| 5 | LEIB | Ibiza Airport | 1031 | 0.985 | Excellent | 99.0 | 7.6 |
| 6 | EDDS | Stuttgart Airport | 756 | 0.984 | Excellent | 98.7 | 13.9 |
| 7 | LFLL | Lyon Saint-Exupéry Airport | 745 | 0.976 | Excellent | 100.0 | 3.5 |
| 8 | LHBP | Budapest Liszt Ferenc International Airport | 1220 | 0.975 | Excellent | 99.6 | 16.3 |
| 9 | LFPO | Paris-Orly Airport | 1935 | 0.971 | Excellent | 99.6 | 4.9 |
| 10 | LPFR | Faro - Gago Coutinho International Airport | 795 | 0.969 | Excellent | 100.0 | 5.8 |
| 11 | ESSA | Stockholm-Arlanda Airport | 1771 | 0.968 | Excellent | 97.1 | 11.4 |
| 12 | ENVA | Trondheim Airport, Værnes | 399 | 0.967 | Excellent | 99.5 | 16.1 |
| 13 | LOWW | Vienna International Airport | 2127 | 0.966 | Excellent | 99.8 | 11.1 |
| 14 | LKPR | Václav Havel Airport Prague | 1337 | 0.962 | Excellent | 99.2 | 8.8 |
| 15 | EDDP | Leipzig/Halle Airport | 451 | 0.961 | Excellent | 100.0 | 20.6 |
| 16 | LPPT | Lisbon Humberto Delgado Airport | 1951 | 0.960 | Excellent | 99.8 | 7.2 |
| 17 | EGGD | Bristol Airport | 743 | 0.958 | Excellent | 100.0 | 24.9 |
| 18 | EGNT | Newcastle International Airport | 420 | 0.956 | Excellent | 99.8 | 19.4 |
| 19 | EGCC | Manchester Airport | 1915 | 0.949 | Excellent | 99.7 | 23.7 |
| 20 | UGKO | David the Builder Kutaisi International Airport | 89 | 0.947 | Excellent | 95.5 | 73.3 |
| 21 | LGAV | Athens Eleftherios Venizelos International Airport | 2685 | 0.940 | Excellent | 98.5 | 9.6 |
| 22 | LMML | Malta International Airport | 712 | 0.934 | Excellent | 99.6 | 12.5 |
| 23 | LEZL | Seville Airport | 624 | 0.932 | Excellent | 99.8 | 8.7 |
| 24 | EGKK | London Gatwick Airport | 2418 | 0.928 | Excellent | 99.9 | 18.5 |
| 25 | LIMF | Turin Airport | 366 | 0.927 | Excellent | 99.7 | 6.6 |
| (64 more rows not shown) | |||||||
Every aerodrome — Tier A (measured by APDF) and Tier B (estimated by NM)
All 352 aerodromes with at least 20 movements in 2026, both tiers together: seen-at-all is answerable everywhere, so this is its complete ranking.
The last column is taxi-out coverage for every one of them. An asterisk marks the 89 Tier A aerodromes, whose figure is measured against the airport’s own times; the other 263 are estimated against Network Manager’s predicted taxi, which is unbiased but loose enough that only the median means anything.
Four in five score exactly 0.000: outside airports with their own records, the network hears nothing from a grounded aircraft.
Every row and column, for 2026. Blanks are blank, not dashed, so a spreadsheet reads the column as numbers.
Loading ITables v2.9.1 from the init_notebook_mode cell...
(need help?)
|
| ⓘ# | ICAO | Aerodrome | Movements 2026 sample (3 days) | Flights seen (%) | Times measured? | Track start vs take-off (min, median) | Track end vs landing (min, median) | Taxi-out received (median) |
|---|---|---|---|---|---|---|---|---|
| 1 | EGGW | London Luton Airport | 1171 | 100.0 | yes | 0.8 | 5.0 | 0.000* |
| 2 | LPFR | Faro - Gago Coutinho International Airport | 795 | 100.0 | yes | -8.6 | 9.4 | 0.937* |
| 3 | LIPE | Bologna Guglielmo Marconi Airport | 782 | 100.0 | yes | 0.9 | 4.4 | 0.000* |
| 4 | EGGD | Bristol Airport | 743 | 100.0 | yes | -9.8 | 9.8 | 0.917* |
| 5 | LFLL | Lyon Saint-Exupéry Airport | 745 | 100.0 | yes | -9.0 | 10.9 | 0.952* |
| 6 | EGPF | Glasgow Airport | 651 | 100.0 | no | -9.0 | 8.8 | 0.856 |
| 7 | LBSF | Sofia Airport | 596 | 100.0 | no | 0.3 | 7.6 | 0.000 |
| 8 | LFBO | Toulouse-Blagnac Airport | 528 | 100.0 | yes | -8.3 | 9.4 | 0.845* |
| 9 | LFRS | Nantes Atlantique Airport | 520 | 100.0 | no | 0.8 | 4.4 | 0.000 |
| 10 | LGKR | Corfu Ioannis Kapodistrias International Airport | 506 | 100.0 | no | 7.5 | -5.5 | 0.000 |
| 11 | EDDP | Leipzig/Halle Airport | 451 | 100.0 | yes | -12.0 | 11.6 | 0.922* |
| 12 | EGAA | Belfast International Airport | 444 | 100.0 | no | 0.7 | 4.4 | 0.000 |
| 13 | LIEE | Cagliari Elmas Airport | 446 | 100.0 | no | 4.7 | -1.7 | 0.000 |
| 14 | EPWR | Copernicus Wrocław Airport | 420 | 100.0 | no | -11.4 | 8.9 | 0.826 |
| 15 | DAAG | Houari Boumediene Airport | 409 | 100.0 | no | 12.9 | -11.7 | 0.000 |
| 16 | EDDN | Nuremberg Airport | 396 | 100.0 | yes | -8.3 | 8.5 | 0.802* |
| 17 | EGNM | Leeds Bradford Airport | 390 | 100.0 | no | -9.5 | 8.6 | 0.875 |
| 18 | DTTA | Tunis Carthage International Airport | 389 | 100.0 | no | 10.8 | -9.4 | 0.000 |
| 19 | EHEH | Eindhoven Airport | 377 | 100.0 | no | 0.3 | 4.5 | 0.000 |
| 20 | LFOB | Beauvais-Tillé airport | 342 | 100.0 | no | 1.2 | 2.2 | 0.000 |
| 21 | LZIB | M. R. Štefánik Airport | 337 | 100.0 | yes | -8.7 | 9.0 | 0.848* |
| 22 | LIPX | Verona Villafranca Valerio Catullo Airport | 328 | 100.0 | no | 1.7 | 2.3 | 0.000 |
| 23 | EGLC | London City Airport | 316 | 100.0 | yes | -2.9 | 7.6 | 0.542* |
| 24 | LIRA | Ciampino–G. B. Pastine International Airport | 299 | 100.0 | yes | 0.5 | 5.6 | 0.000* |
| 25 | EKBI | Billund Airport | 290 | 100.0 | no | 0.7 | 4.4 | 0.000 |
| (327 more rows not shown) | ||||||||
Where these aerodromes are
The outlined box is the ingested area, coloured by coverage band; grey means only detection was measurable. Aerodromes outside it don’t appear: never sampled, so a number for them would describe the boundary, not the receivers.
What “coverage” means here
Two questions, and the difference between them is what the site is about.
How much of its time on the ground was received? The taxi is bounded by real stand and runway times; we count how many of the expected 5-second reports arrived, where recorded. It varies a lot.
Was the flight seen at all? One position report between take-off and landing. Answerable everywhere, and above 99% almost everywhere, so it barely separates anything.
The coverage index multiplies the two. An aerodrome can score 99% on the second and near zero on the first: tracked in the air, invisible on the ground.
A third question sits between them: Network Manager’s predicted taxi duration gives aerodromes with no measured times a median estimated taxi-out share, the second table’s last column. Arrivals have no equivalent; no in-block time exists outside APDF.
What the ranking does not say
- An aerodrome outside the ingested area is absent, not ranked last; flights to it count at the European end.
- A low coverage index can have two causes, needing different fixes. Flights are cut from one continuous position stream per aircraft, with no marker between flights:
- split: cut into several tracks and scored against the largest piece, so a departure’s track starts a median 6.5 minutes late and coverage is understated.
- merged: two flights share one track; the other vanishes entirely. Merged movements are 0.8% of the sample; the survivor’s coverage barely shifts, but the vanished flight is missing, not undercounted.
- The two tiers are never merged into one table.
The fleet
Every figure below counts movements in 2026, over the three sampled days.
How the aerodromes sit as a group: each row a measure, columns its spread — middle value, middle half, worst and best tenths.
Half receive less than a fifth of a typical taxi-out. The two “seen” rows stay near 100% for most, dropping to 87% only in the worst tenth, not the headline.
| metric | n | median | IQR | p10 | p90 | |
|---|---|---|---|---|---|---|
| 0 | Taxi-out received — measured aerodromes | 89 | 0.191 | 0.000 – 0.877 | 0.000 | 0.959 |
| 1 | Taxi-in received — measured aerodromes | 89 | 1.000 | 0.978 – 1.000 | 0.439 | 1.000 |
| 2 | Coverage index — measured aerodromes | 89 | 0.590 | 0.487 – 0.932 | 0.193 | 0.969 |
| 3 | Flights seen — all aerodromes | 352 | 99.7% | 97.1% – 100.0% | 87.0% | 100.0% |
| 4 | Flights seen — aerodromes with measured times | 89 | 99.7% | 99.2% – 99.8% | 95.9% | 100.0% |